

China Air Quality Trends – July 2026 Snapshot – Centre for Research on Energy and Clean Air
By Xiaoli Zhang, Qi Qin; Data scientist: Danny Hartono; with contributions from Lauri Myllyvirta, Lead Analyst
Sixteen provincial capitals remained above China’s annual PM2.5 standard at the end of July. July also brought a broad year-on-year rebound: PM2.5 rose in 18 capitals and ozone in 19, while five capitals exceeded the annual ozone limit. NO₂ still fell in most capitals, and the balance of emissions and weather differed markedly by city.
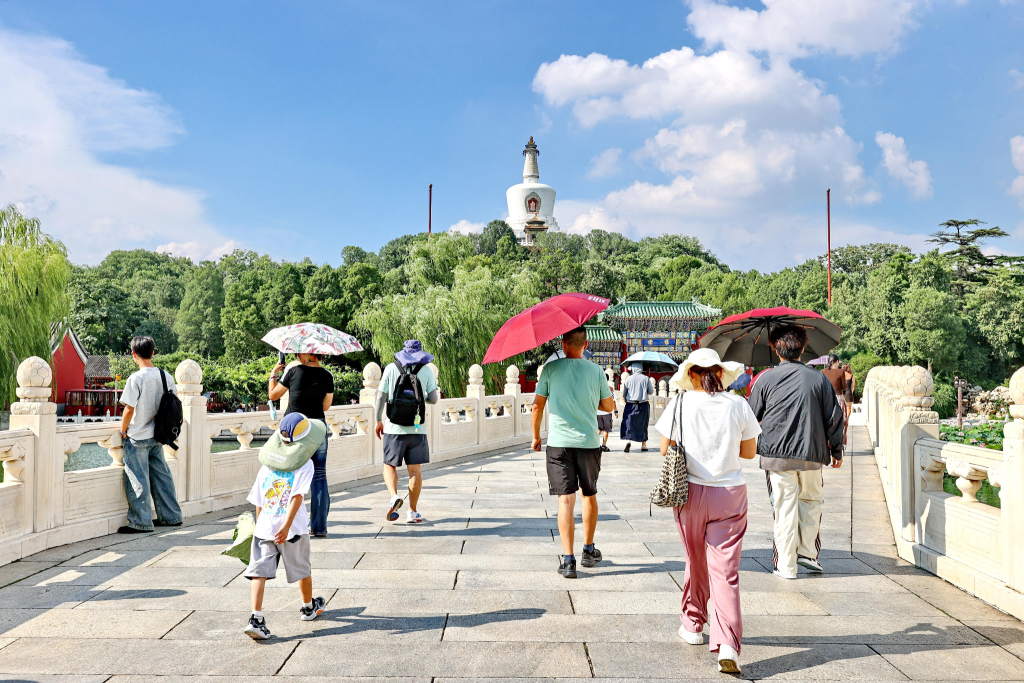
Tourists visit Beihai Park despite scorching heat in Beijing, China, August 3, 2026. (Photo by Imaginechina/Sipa USA) Credit: Sipa US/Alamy Live News
Key findings
- At the end of July, sixteen of China’s 31 provincial capitals had 12-month average PM2.5 concentrations above 30 µg/m³, exceeding the latest national standard. Non-compliant cities remained concentrated in the Beijing-Tianjin-Hebei region and parts of the Northeast and Northwest; Shijiazhuang and Zhengzhou had the highest average concentrations, both at about 41 µg/m³, followed by Tianjin at about 38 µg/m³.
- PM2.5 rose year-on-year in 18 provincial capitals in July. The largest increases were in Changchun (+55%), Shanghai (+45%), and Chengdu (+32%), while Hefei recorded the largest decline (-40%).
- Five provincial capitals exceeded the annual ozone assessment limit: Xi’an (168 µg/m³), Taiyuan (167 µg/m³), Shijiazhuang and Tianjin (both roughly 164 µg/m³), and Zhengzhou (about 161 µg/m³). Ozone rose year-on-year in 19 capitals, led by Shanghai (+38%) and Xi’an (+25%). In the presence of precursors such as NOₓ and VOCs (volatile organic compounds), high summer temperatures and strong solar radiation generally favour the photochemical formation of ozone, which remains an important constraint on summer air-quality improvement in some cities.
- Multi-pollutant pressure remained concentrated mainly in northern capitals. Taiyuan ranked near the top for all three pollutants; Shijiazhuang and Tianjin ranked high for both PM2.5 and ozone, while Lanzhou combined relatively high PM2.5 and NO₂. Chengdu also ranked high for PM2.5 and ozone.
- Weather conditions and emissions-related factors jointly shaped the year-on-year changes in PM2.5 and ozone in July, but the dominant factor varied by city; the two components either reinforced or offset each other. NO₂ showed a more consistent downward signal: concentrations fell year-on-year in 25 provincial capitals, while the emissions-related component declined in 24.
- The broad decline in NO₂ is consistent with reduced petrol and diesel demand associated with transport electrification—EVs (electric vehicles) displaced an estimated 33.7 Mtoe of oil consumption in H1 2026—but the city-level decomposition cannot isolate the specific contribution of EV adoption.
16 provincial capitals remain above the new annual PM2.5 standards
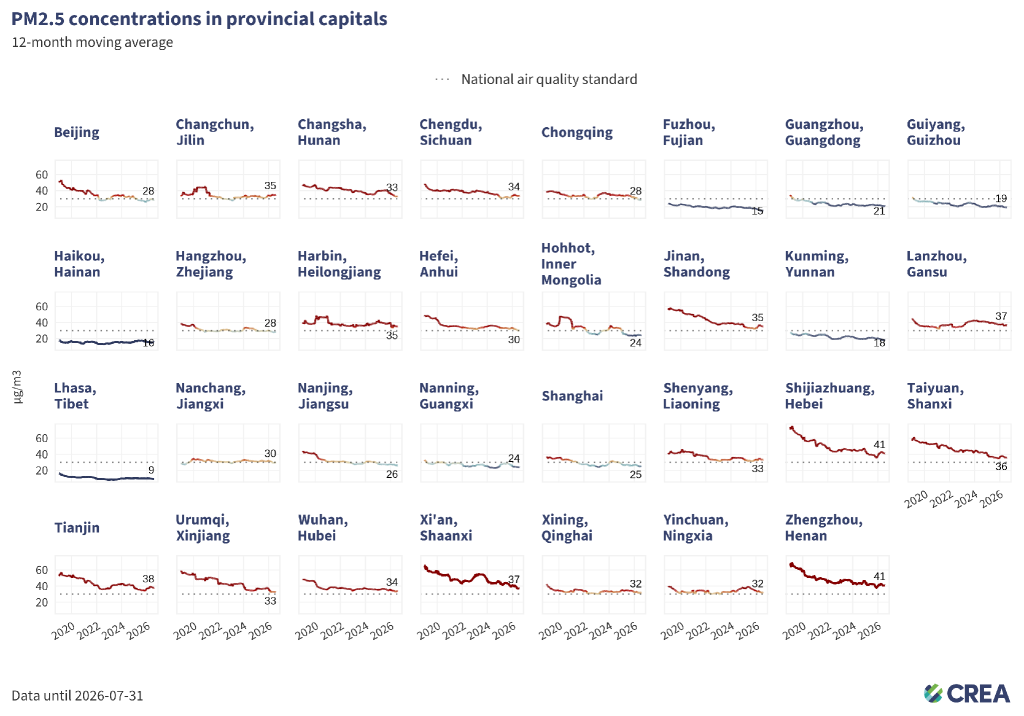
- As of the end of July, 16 of China’s 31 provincial capitals had 12-month average PM2.5 concentrations above the national annual standard of 30 µg/m³. The standard was tightened from 35 µg/m³ to 30 µg/m³ in March 2026.
- The cities with the highest PM2.5 levels were still concentrated in the Beijing-Tianjin-Hebei surrounding area. Shijiazhuang (Hebei) and Zhengzhou (Henan) recorded the highest 12-month average PM2.5 levels, both at about 41 µg/m³, followed by Tianjin at about 38 µg/m³.
- The other non-compliant capitals were Xi’an, Lanzhou, Taiyuan, Changchun, Jinan, Harbin, Wuhan, Chengdu, Shenyang, Urumqi, Changsha, Yinchuan, and Xining, showing that elevated PM2.5 was spread across northern, central, and western China.
PM2.5 levels rose year-on-year in 18 provincial capitals in July
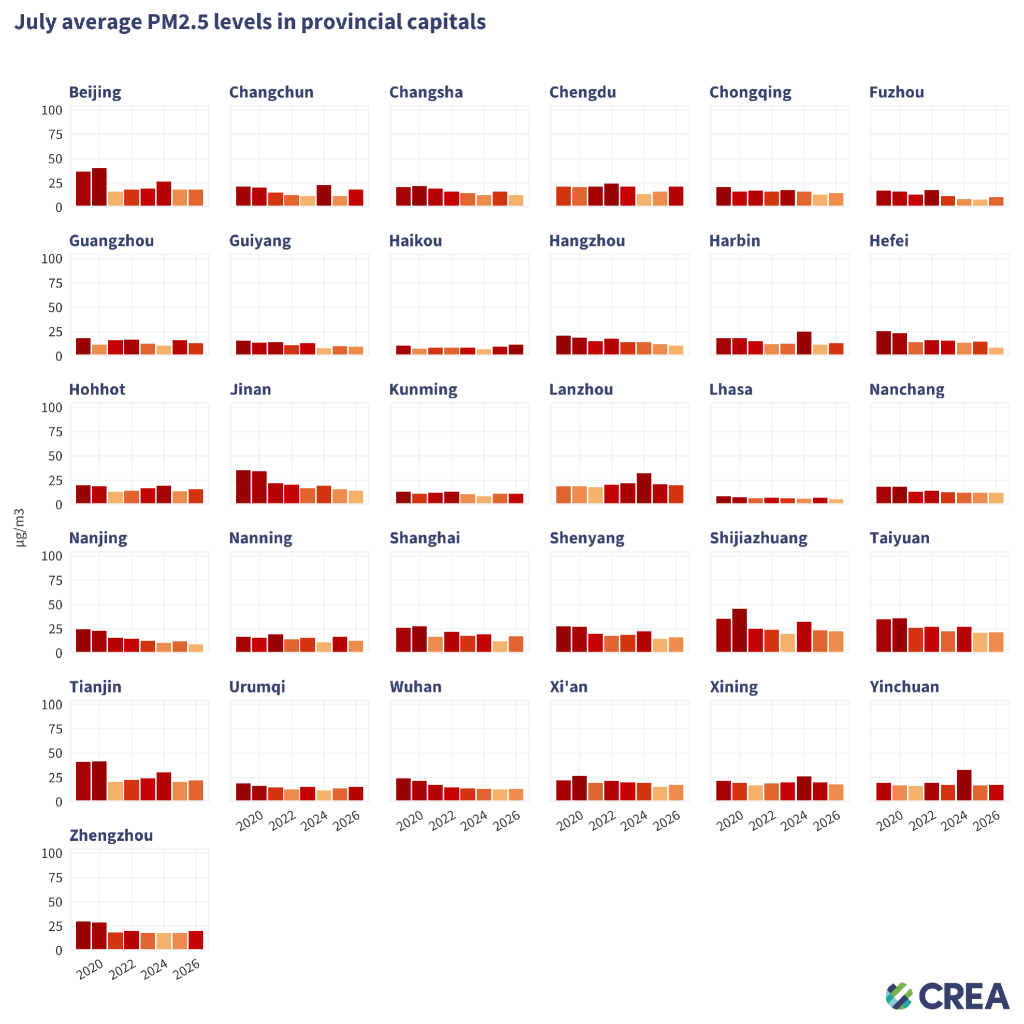
- The largest year-on-year increases were recorded in Changchun (+55%), Shanghai (+45%), Chengdu (+32%), and Fuzhou (+31%).
- The largest declines were in Hefei (-40%), Nanjing (-23%), Nanning (-23%), and Changsha (-22%).
- Shijiazhuang recorded the highest July average PM2.5 concentration at about 23 µg/m³, followed by Tianjin, Taiyuan, and Chengdu at about 22 µg/m³.
Five provincial capitals exceeded the annual ozone limit
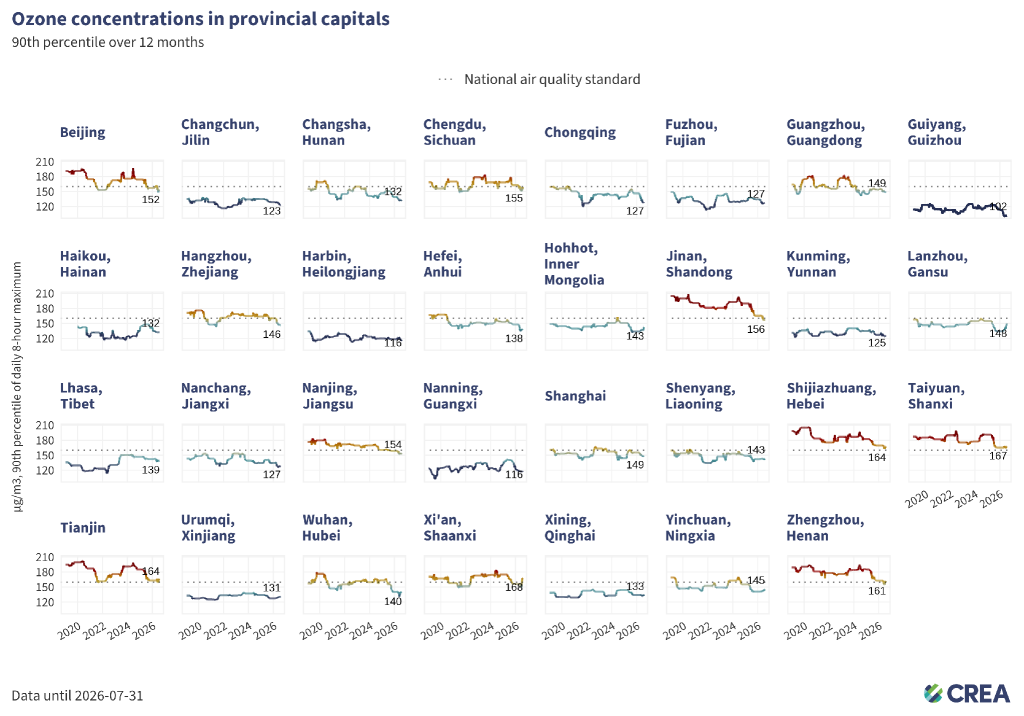
- At the end of July 2026, five of the 31 provincial capitals recorded 12-month 90th percentile ozone concentrations above the national standard of 160 µg/m³.
- Xi’an recorded the highest annual ozone assessment value at 168 µg/m³, followed by Taiyuan at 167 µg/m³. Shijiazhuang and Tianjin recorded levels of roughly 164 µg/m³, and Zhengzhou was roughly at 161 µg/m³.
- All five non-compliant capitals were in northern China, underlining the persistence of regional ozone pressure across the Beijing-Tianjin-Hebei region and nearby inland provinces.
Ozone levels rose year-on-year in 19 provincial capitals in July
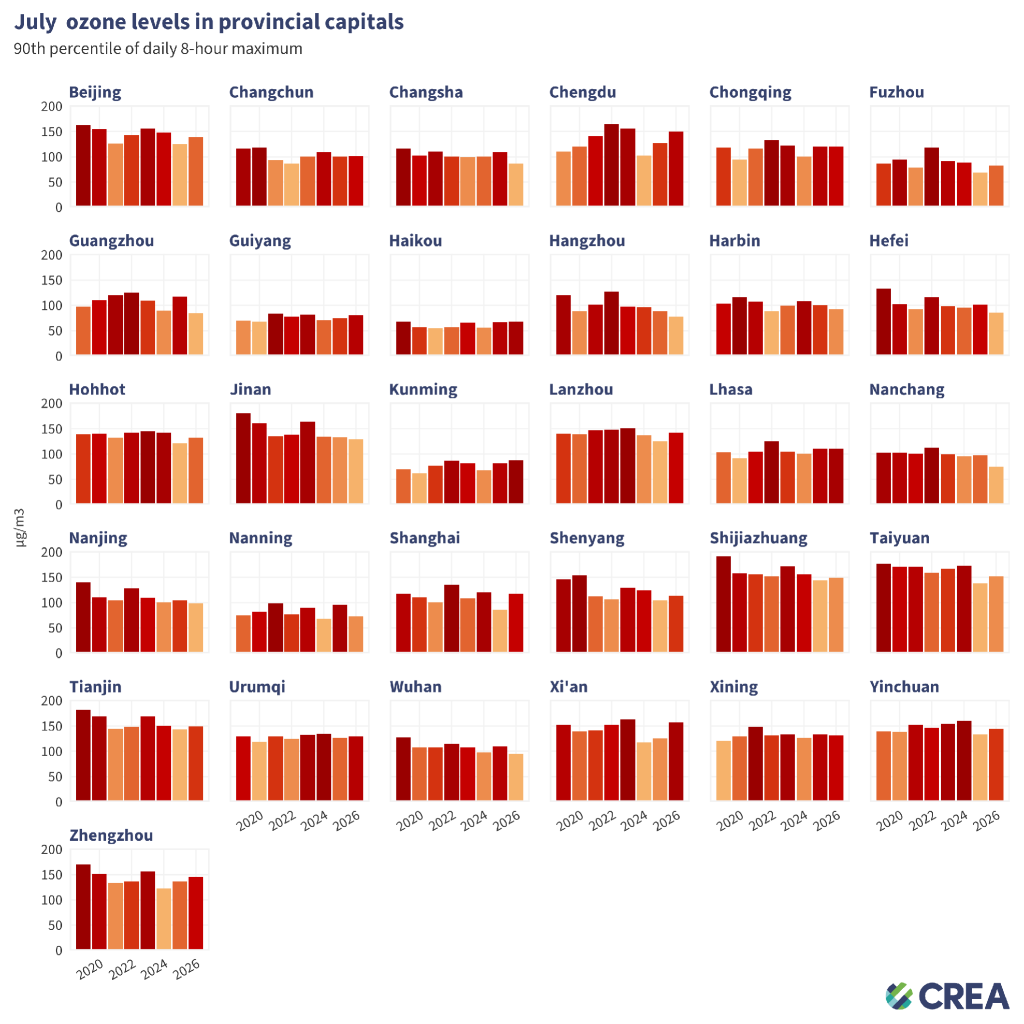
- The largest year-on-year increases were recorded in Shanghai (+38%), Xi’an (+25%), Fuzhou (+19%) and Chengdu (+18%).
- The largest declines were in Guangzhou (-28%), Nanning (-24%), Nanchang (-24%) and Changsha (-21%).
- Shanghai, Xi’an, and Chengdu were among the capitals where both PM2.5 and ozone increased, illustrating that the two pollutants can worsen together even when their drivers differ.
Multi-pollutant pressure spanned northern capitals and Chengdu
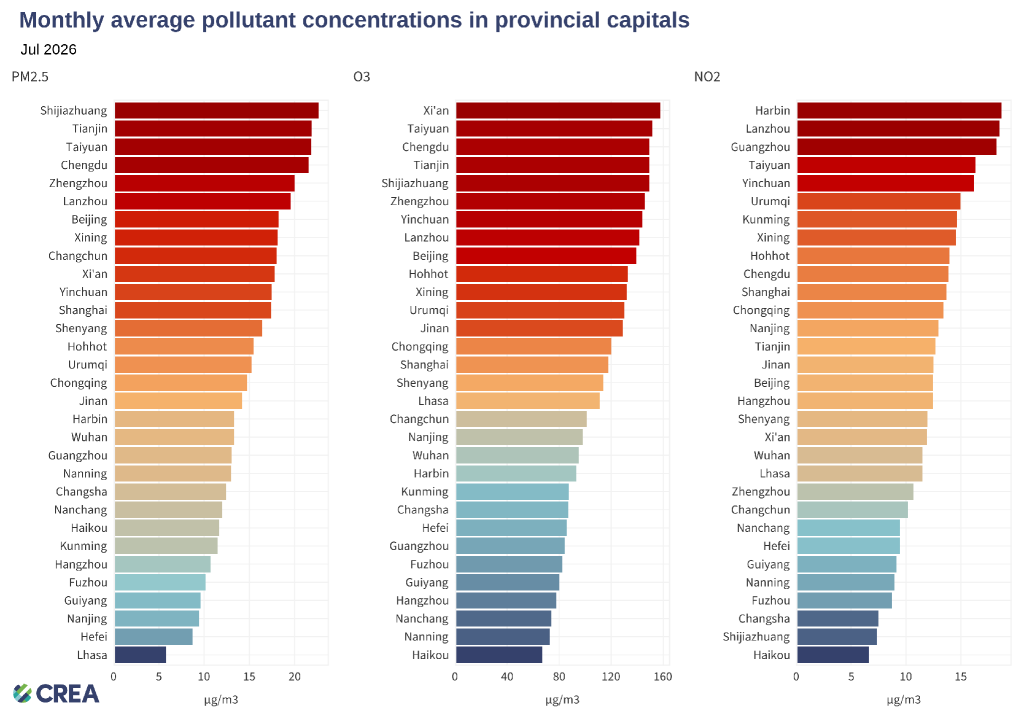
- Taiyuan ranked near the top for all three pollutants in July. Shijiazhuang and Tianjin ranked high for both PM2.5 and ozone, Chengdu also faced elevated PM2.5 and ozone, and Lanzhou saw a combination of relatively high PM2.5 and NO₂.
- Cities with lower pollution levels were concentrated mainly in southern or coastal China. Haikou, Fuzhou, and Guiyang ranked among the lower-concentration capitals for all three pollutants, with Haikou recording the lowest ozone and NO₂ levels among the 31 capitals.
Emissions and weather jointly shaped July’s changes
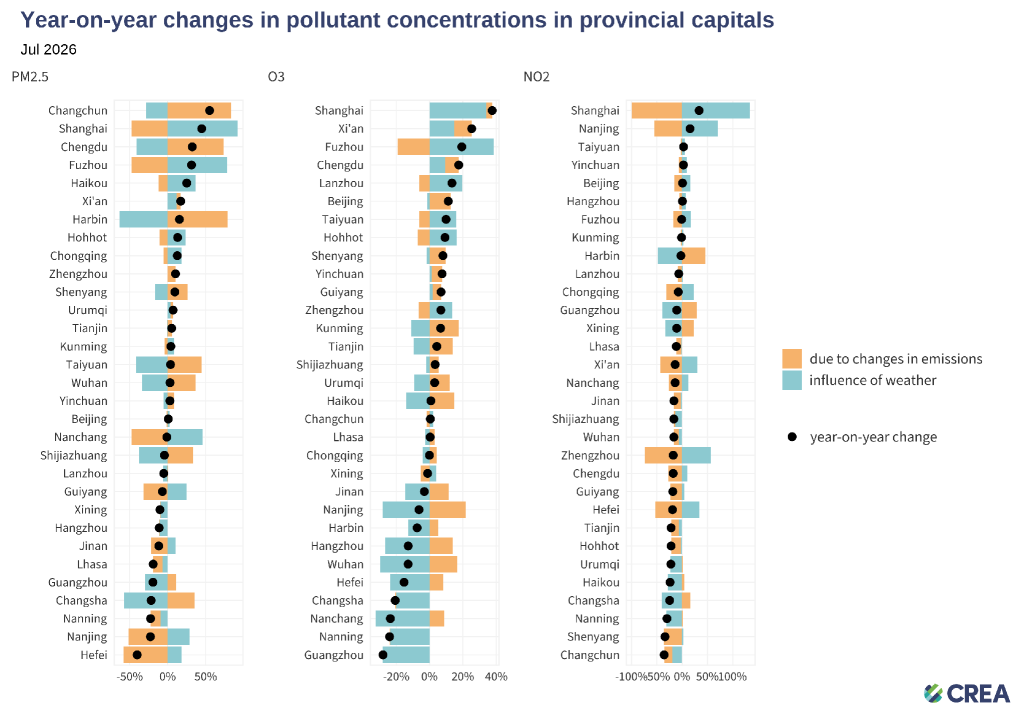
- PM2.5 increased in 18 capitals. The emissions component was positive in 15 capitals and the weather component in 15, but not always in the same cities. In Changchun and Chengdu, an upward emissions contribution outweighed favourable weather; in Shanghai and Fuzhou, unfavourable weather outweighed a downward emissions contribution.
- For ozone, the emissions component was positive in 22 capitals, while weather exerted downward pressure in 19; total concentrations still rose in 19. NO₂ moved in the opposite direction: observed concentrations fell in 25 capitals, and the emissions component fell in 24. These weather-normalised components are analytical estimates, not direct emissions measurements.
- China’s 15th Five-Year Plan targets reductions of more than 8% in national NOₓ and VOC emissions over 2026–30, but does not set a quantitative national target for ambient ozone concentrations. The broad decline in NO2 is directionally consistent with the NOₓ objective, while July’s ozone rebound underscores the need to track ozone concentrations separately.
Worst 7-day air pollution episodes by pollutant
PM2.5 (excluding sandstorms)
| City | Province | Dates | Average concentration | Highest daily concentration |
| Tangshan | Hebei | Jun 27 – Jul 03 | 36.0523 | 43.5104 |
| Hebi | Henan | Jun 27 – Jul 03 | 34.9914 | 41.5167 |
| Suqian | Jiangsu | Jun 26 – Jul 02 | 34.6965 | 58.4479 |
| Suzhou | Anhui | Jun 25 – Jul 01 | 33.9734 | 54.2312 |
| Kaifeng | Henan | Jun 27 – Jul 03 | 33.6468 | 39.2708 |
Sandstorms (PM2.5)
| City | Province | Dates | Average concentration | Highest daily concentration |
| Zhongwei | Ningxia | Jun 25 – Jul 01 | 11.4226 | 79.9583 |
Ozone
| City | Province | Dates | Average concentration | Highest daily concentration |
| Baoding | Hebei | Jun 28 – Jul 04 | 204.4796 | 247.4821 |
| Dezhou | Shandong | Jun 27 – Jul 03 | 201.9750 | 225.0500 |
| Hengshui | Hebei | Jun 27 – Jul 03 | 201.5268 | 229.4688 |
| Langfang | Hebei | Jun 28 – Jul 04 | 200.6652 | 249.7500 |
| Heze | Shandong | Jun 26 – Jul 02 | 199.9643 | 210.2500 |
NO₂
| City | Province | Dates | Average concentration | Highest daily concentration |
| Meishan | Sichuan | Jul 18 – Jul 24 | 34.2246 | 42.0833 |
| Luohe | Henan | Jun 27 – Jul 03 | 33.0332 | 38.0701 |
| Harbin | Heilongjiang | Jun 25 – Jul 01 | 30.0251 | 34.5364 |
| Jiamusi | Heilongjiang | Jul 18 – Jul 24 | 26.9080 | 34.6458 |
| Yulin | Shaanxi | Jul 13 – Jul 19 | 26.4125 | 41.0556 |
Unit: µg/m3
Relevant analysis by CREA:
Carbon-intensive industries are worsening China’s ozone pollution
China H1 2026 Air quality review: EV-related oil cuts emerge as a new driver for China’s clean air progress
China’s air pollution control enters ‘deep water’ phase
Why is China’s air pollution shifting west?
China’s coal-to-chemicals growth risks climate goals
Why China should get tougher on smog