

Warming U.S. Cities Face Higher Cooling Demand and Energy Bills
KEY FACTS
-
Demand for cooling is rising across the U.S., contributing to higher energy bills as households rely more on air conditioning in our warming climate.
-
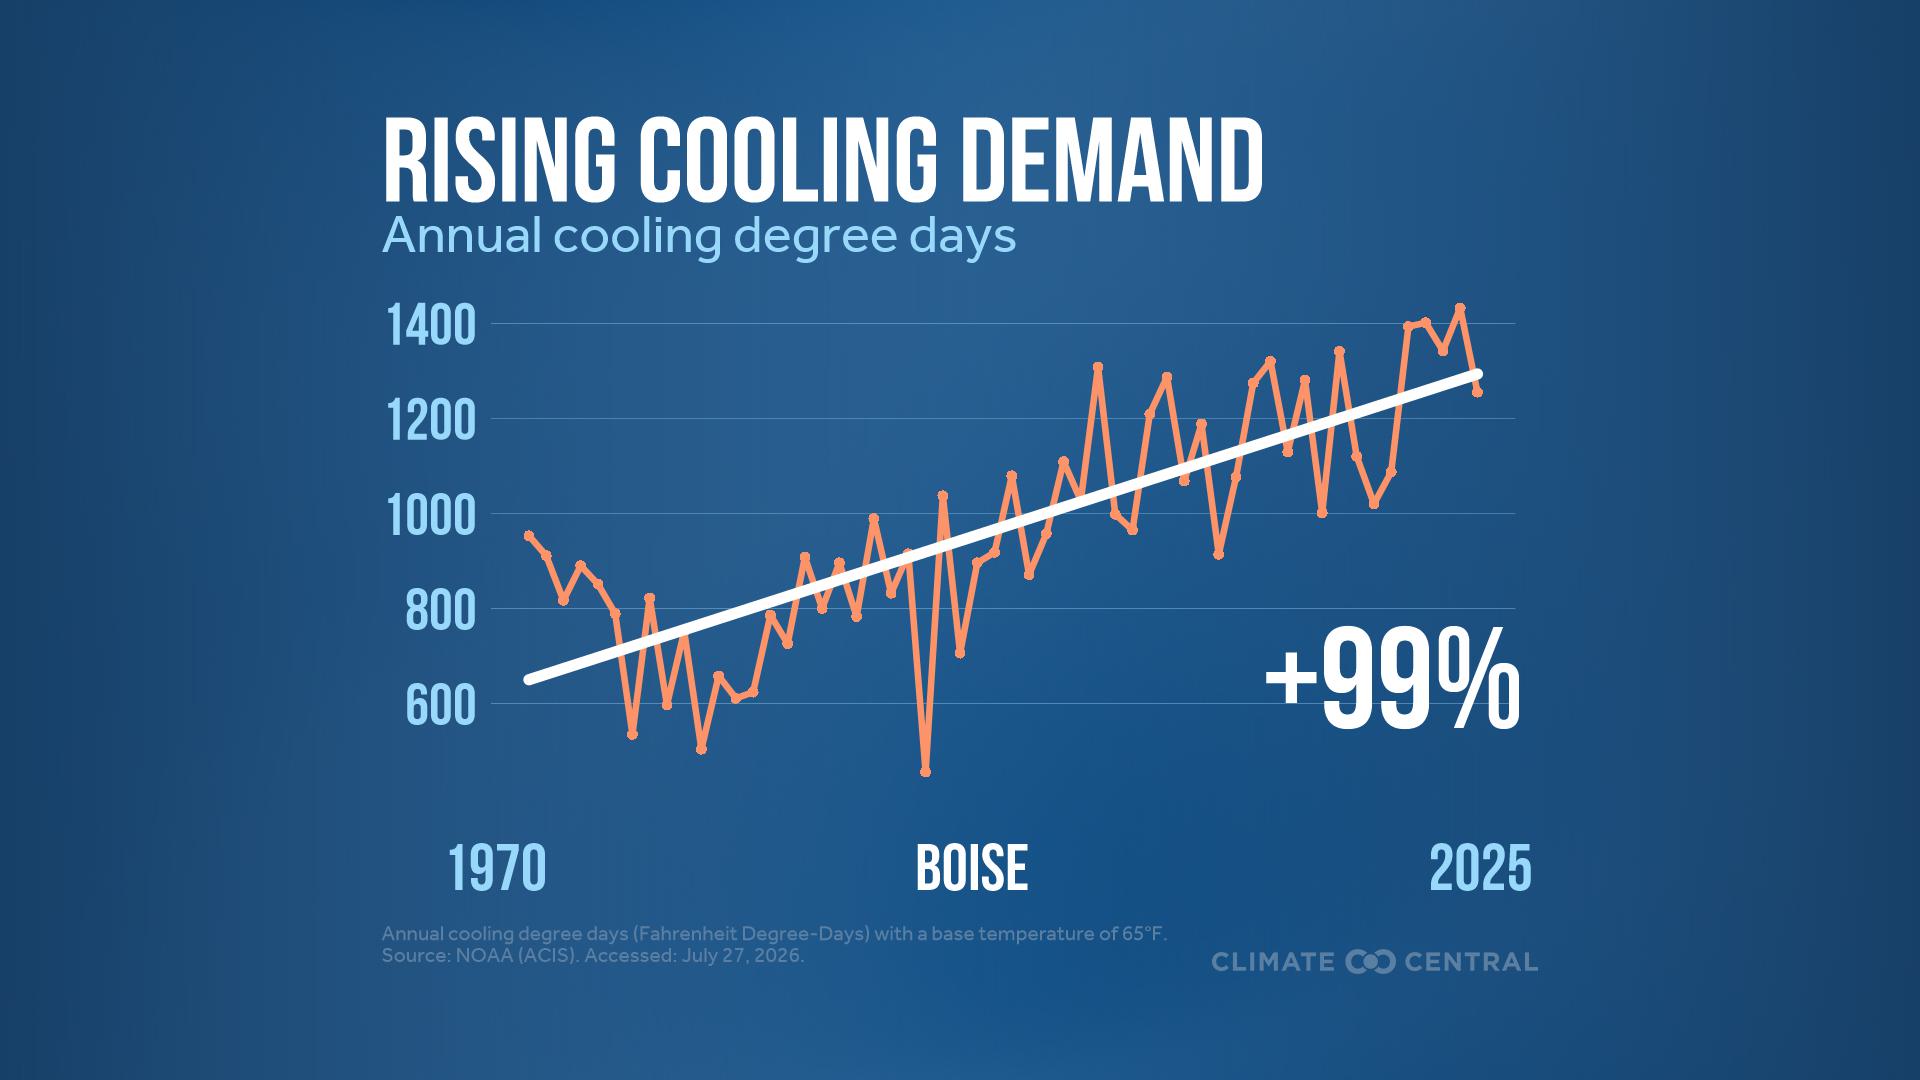
Cooling degree days — a temperature-based metric used to estimate the demand for energy to cool buildings — have increased since 1970 in 97% of the 241 major U.S. cities analyzed by Climate Central.
-
Based on long-term trends in cooling degree days, these cities have seen a 37% increase in cooling demand, on average, since the early 1970s.
-
Households tend to spend more on cooling in warmer U.S. states that have higher annual cooling degree days.
-
In the 10 states with the highest average cooling costs, households spent between $378 (in Hawaii) and $712 (in Arizona) on cooling in 2020.
-
As the climate warms, rising cooling demand and electricity costs can make it harder for people who lack or cannot afford air conditioning to stay safe during extreme heat events.
This Climate Matters analysis is based on open-access data from the National Oceanic and Atmospheric Administration (NOAA) and the U.S. Energy Information Administration (U.S. EIA). See Methodology for details.
VISUALS
LEARN MORE
FULL REPORT
Hotter climate, higher cooling demand, rising energy bills
As the planet warms, more indoor cooling is needed to keep homes, schools, and other buildings at safe, comfortable temperatures.
As hotter summers increase the need for air conditioning, many households are facing rising energy bills. Residential electricity prices in the U.S. rose by 31% from 2020 to 2025 amid a surge in electricity demand fueled in part by data centers.
Hotter, longer summers and higher electricity prices can increase the financial burden of cooling homes, especially for low-income households balancing comfort and safety with affordability.
Estimating cooling demand
A temperature-based metric called cooling degree days (CDD) is used to estimate the demand for energy to cool buildings.
CDD values estimate how much cooling is needed to maintain a comfortable and safe indoor air temperature.
-
Daily CDD values represent the difference between a location’s daily average outdoor temperature and 65°F, an engineering standard that is considered the ideal indoor temperature.
-
For example, a day with an average temperature of 90°F has 25 CDD (90°- 65°).
Daily CDD values are highest on the hottest days of the year. But on any day over 65°F, including warm late summer and early fall days, people will likely have some need for indoor cooling.
Annual total CDD values reflect how much of the year is spent above 65°F, and generally how prevalent the local need for indoor cooling is.
Cooling demand rising in 97% of U.S. cities analyzed
Climate Central used historical temperature data to analyze the change in annual CDD values from 1970 to 2025 in 241 U.S. cities. These trends provide a proxy for the changing local demand for energy to cool homes and buildings as the climate has warmed since 1970.
-
Nearly all (97% or 233) of the 241 cities analyzed experienced an increase in annual CDD since 1970.
-
On average, these 233 cities have experienced a 37% increase in annual CDD since the early 1970s. In other words, based on long-term CDD trends, these cities have seen a 37% increase in cooling demand, on average, since the early 1970s.
-
The Northwest and West have seen the largest increases in annual CDD: an average increase of 90% and 57%, respectively, than during the early 1970s.
-
The cities with the largest increases in CDD (each more than doubling since 1970) were: Reno, NV (+417%); Helena, MT (+179%); Seattle, WA (+160%); Santa Maria, CA (+124%); and Portland, OR (+113%).
Download data to explore results for all 241 U.S. cities analyzed.
Households in hotter states pay more to stay cool
Rising cooling demand can lead to higher energy bills for U.S. households relying more on air conditioning in our warming climate.
Using the latest state energy consumption data from the U.S. Energy Information Administration, Climate Central analyzed how much the average household in each state spent to cool their homes in 2020.
Warmer states with higher annual CDD (i.e., that spend more of the year at temperatures well above 65°F) tend to have higher average household cooling costs.
The top 10 states with the highest average household cooling costs are located in the warmest U.S. regions: the Southwest, South, Southeast, and West, plus Hawaii.
Across these 10 states, the average household spent between $378 (in Hawaii) and $712 (in Arizona) on cooling alone in 2020.
|
Top 10 states |
Average household cooling cost in 2020 ($) |
Share of electricity bill spent on cooling in 2020 (%) |
Annual cooling degree days in 2020 (Fahrenheit Degree-Days) |
|---|---|---|---|
|
1. Arizona |
$712 |
39% |
4431 |
|
2. Florida |
$546 |
34% |
4174 |
|
3. Texas |
$505 |
32% |
3129 |
|
4. Louisiana |
$481 |
32% |
2969 |
|
5. Mississippi |
$439 |
28% |
2375 |
|
6. Nevada |
$438 |
32% |
3094 |
|
7. Alabama |
$433 |
24% |
2168 |
|
8. Georgia |
$431 |
25% |
2018 |
|
9. South Carolina |
$420 |
25% |
2083 |
|
10. Hawaii |
$378 |
17% |
4154 |
With the exception of Hawaii, households in the top 10 states spent at least one-quarter of their annual electricity bills on cooling in 2020. The nationwide average was 18%.
Cooling costs are likely to rise with future warming due to heat-trapping pollution.
In the U.S., household cooling demand is projected to rise 43% over 2025 levels by 2050, according to the U.S. Energy Information Administration’s latest outlook.
These projected increases are likely underestimates because they don’t account for additional cooling demand due to increasing humidity. Humid heat is becoming more frequent across the U.S. and can make extreme heat even more dangerous.
Higher energy costs can increase heat risks for some
Higher cooling demand and rising energy bills can increase heat risks for households that lack or can’t afford to run air conditioning.
Although only about 7% of U.S. households lack air conditioning, these households are disproportionately low-income.
According to a 2024 report from the American Council for an Energy-Efficient Economy, people with low incomes and Black and Hispanic households in the largest U.S. metro areas spend a larger share of their income on energy bills than other households — increasing the financial burden of keeping indoor spaces cool.
This can make extreme heat events riskier for these groups. For example, a 2022 study found that low-income households in Arizona start using home cooling at 5°F to 7°F higher outdoor temperatures than high-income households.
Some of the fastest-warming regions in the U.S., such as the Southwest, Upper Midwest, and Northeast have the greatest proportion of households without air conditioning.
Effects of increased reliance on cooling
Access to indoor cooling is critical to ensure health and safety in a rapidly warming world with more frequent and intense extreme heat events. Air conditioning allows us to work and learn effectively, keeps food and medical supplies safe, and reduces the risk of heat-related illness.
But the increased energy use needed to meet accelerating cooling demand can strain electricity grids, drive up emissions, and worsen urban heat islands. Side effects of rising cooling demand include:
-
The energy used to cool buildings currently relies heavily on fossil fuels. Without a cleaner energy supply, more cooling therefore means higher carbon pollution and more warming.
-
The growing demand for air conditioning can strain power grids. This can become dangerous, especially if a power grid fails during a heatwave.
-
Chemicals used in air conditioning, such as hydrofluorocarbons, are extremely powerful greenhouse gases with a global warming potential far greater than carbon dioxide. Global agreements in place aim to phase down the use of hydrofluorocarbons in the decades ahead.
-
Air conditioners emit waste heat back outside. In a city with millions of air conditioners running and releasing waste heat into the outside air, this can increase the urban heat island effect.
RELATED RESOURCES
LOCAL STORY ANGLES
How is energy consumption changing in your region?
Download U.S. and state-level graphics showing cooling and heating demand trends since 1970. Check out the U.S. Energy Information Administration state-level statistics, including energy consumption by source, sector, prices and more. Explore NOAA’s Residential Energy Demand Temperature Index (REDTI). Based on cooling and heating degree days, REDTI helps explain year-to-year fluctuations in residential heating and cooling demands.
Explore areas that are vulnerable to heat amplified by climate change.
HeatRisk is an interactive map tool from the National Weather Service, now available for the contiguous U.S. This color-numeric index shows current and forecast risk of daily local heat-related impacts. Climate Central’s Climate Shift Index map tool shows the influence of human-caused climate change on daily temperatures around the globe. Check out U.S. Census Bureau maps for state, county, and census tract level data on areas that lack air conditioning.
Are there ways to cool homes while also saving on energy bills?
The National Center for Healthy Housing lists cooling centers by state. The World Health Organization shares cooling tips. Low Income Home Energy Assistance Program (LIHEAP) helps alleviate heat stress for the most vulnerable populations, by helping with energy bills and making homes more energy efficient. Find rebates on ENERGY STAR, certified energy efficient products.
CONTACT EXPERTS
To request an interview with a Climate Central expert about this analysis, please contact Abbie Veitch, aveitch@climatecentral.org.
Maximilian Auffhammer, PhD
Professor
Department of Agricultural and Resource Economics
University of California, Berkeley
Contact: auffhammer@berkeley.edu
Expertise: Environmental and energy economics
FIND EXPERTS
Submit a request to SciLine from the American Association for the Advancement of Science or to the Climate Data Concierge from Columbia University. These free services rapidly connect journalists to relevant scientific experts.
Browse maps of climate experts and services at regional NOAA, USDA, and Department of the Interior offices.
Explore databases such as 500 Women Scientists, BIPOC Climate and Energy Justice PhDs, and Diverse Sources to find and amplify diverse expert voices.
Reach out to your State Climate Office or the nearest Land-Grant University to connect with scientists, educators, and extension staff in your local area.
METHODOLOGY
Calculating cooling degree day trends in U.S. cities
Annual cooling degree day (CDD) data from 1970-2025 were obtained from the Applied Climate Information System, which is developed, maintained, and operated by NOAA’s Regional Climate Centers. Data was accessed on July 27, 2026. CDDs were calculated as the sum of the daily cooling degree days each year using a base temperature of 65°F. The percent change in annual CDDs from 1970-2025 is based on linear regression. Climate Central’s CDD analysis includes 247 stations. Data summaries based on linear trends include 241 total locations due to data gaps in six stations: Anchorage, AK; Bend, OR; Hazard, KY; Jefferson City, MO; Juneau, AK; Twin Falls, ID.
Assessing residential cooling costs in U.S. states
Data on residential cooling costs and electricity expenditure were obtained from the U.S. Energy Information Administration’s Residential Energy Consumption Survey (RECS) 2020 Microdata. Data was accessed in April 2026. Average household cooling costs represent the total annual electricity expenditure on air conditioning and cooling equipment per household, derived from the RECS end-use variables for direct air conditioning costs and furnace fan cooling costs.
To estimate how cooling demand affects household electricity costs, Climate Central modeled comparative cooling costs across states using the survey-weighted state-level averages derived from the 2020 RECS microdata. To isolate the effect of temperature from other factors that differ across states, the model controls for average home square footage and state-level air conditioning penetration rates. All regressions are estimated at the state level using 51 observations (50 states plus Washington, D.C.). Thanks to Gargee Goswami for assistance with analysis of residential cooling costs.
Comments are closed.