
Today in Energy – U.S. Energy Information Administration (EIA)
In-brief analysis
Jul 15, 2026
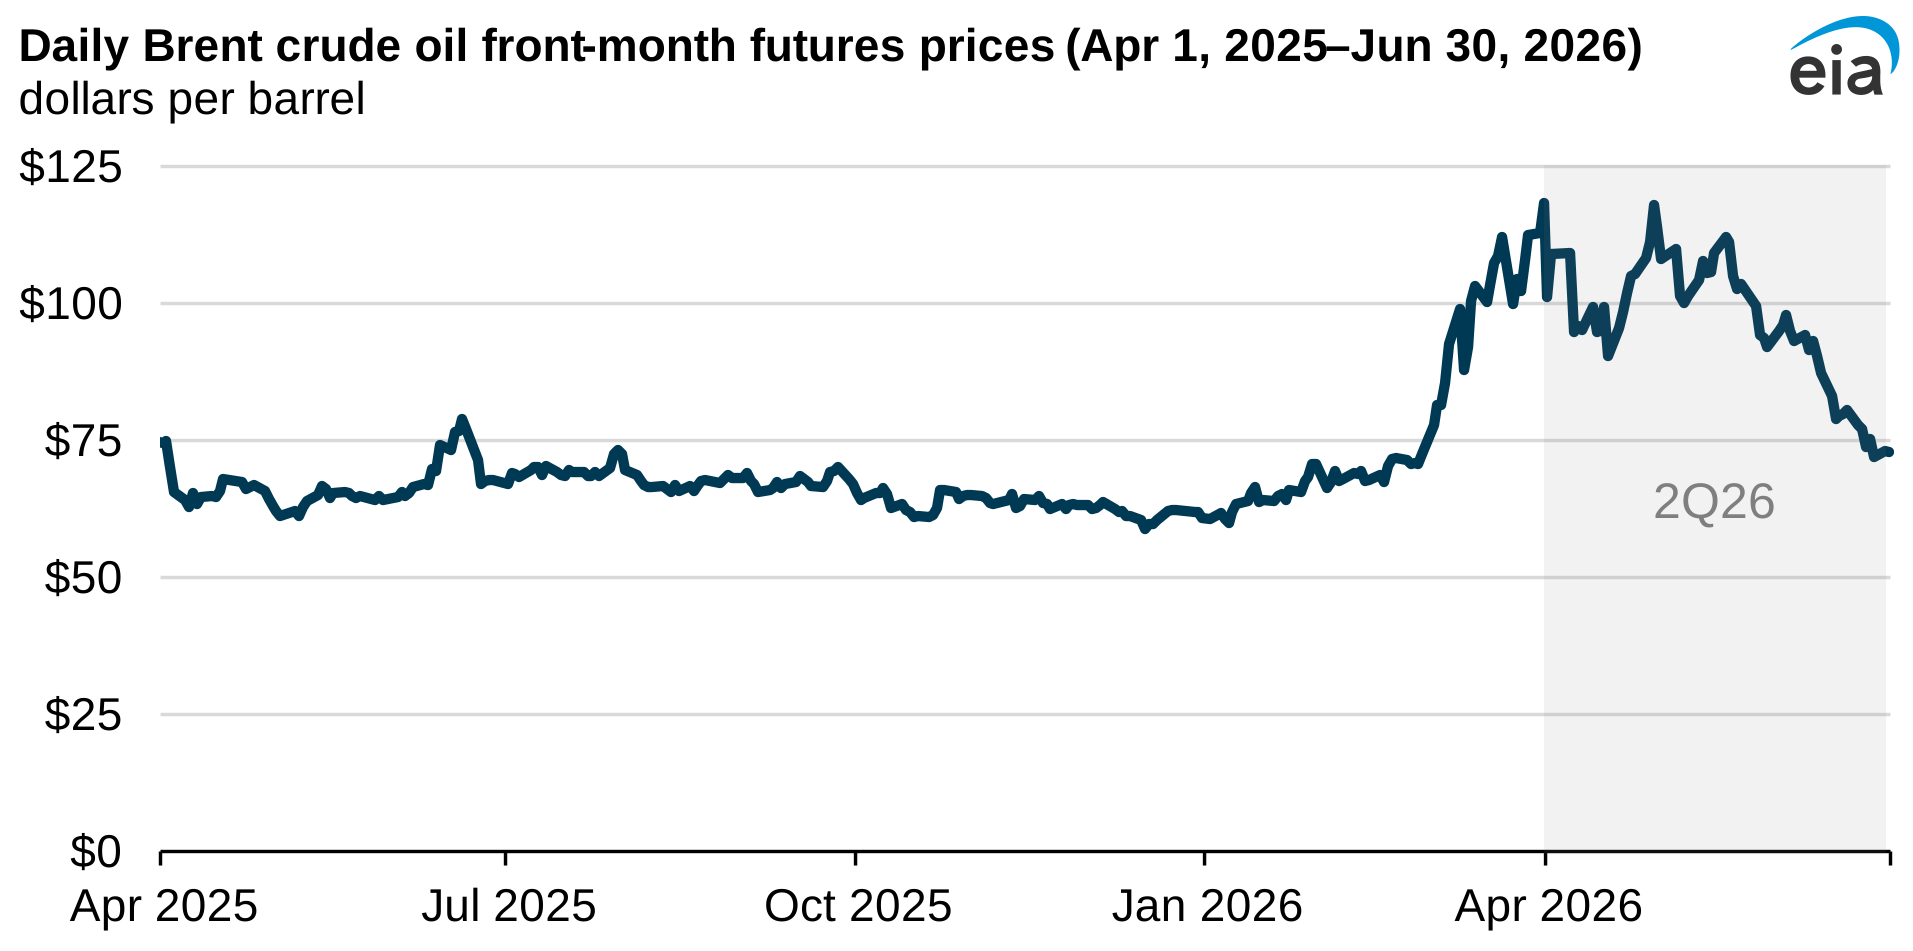
Data source: Bloomberg L.P.
Note: 2Q26=second quarter of 2026
Petroleum markets in the second quarter of 2026 (2Q26) were characterized by continued disruptions to international crude oil and petroleum product flows through the Strait of Hormuz, contributing to higher and more volatile crude oil prices through most of the quarter. The disruptions also resulted in international buyers seeking alternative supply sources for petroleum products, driving up U.S. refinery margins, production, and exports.
In-brief analysis
Jul 14, 2026
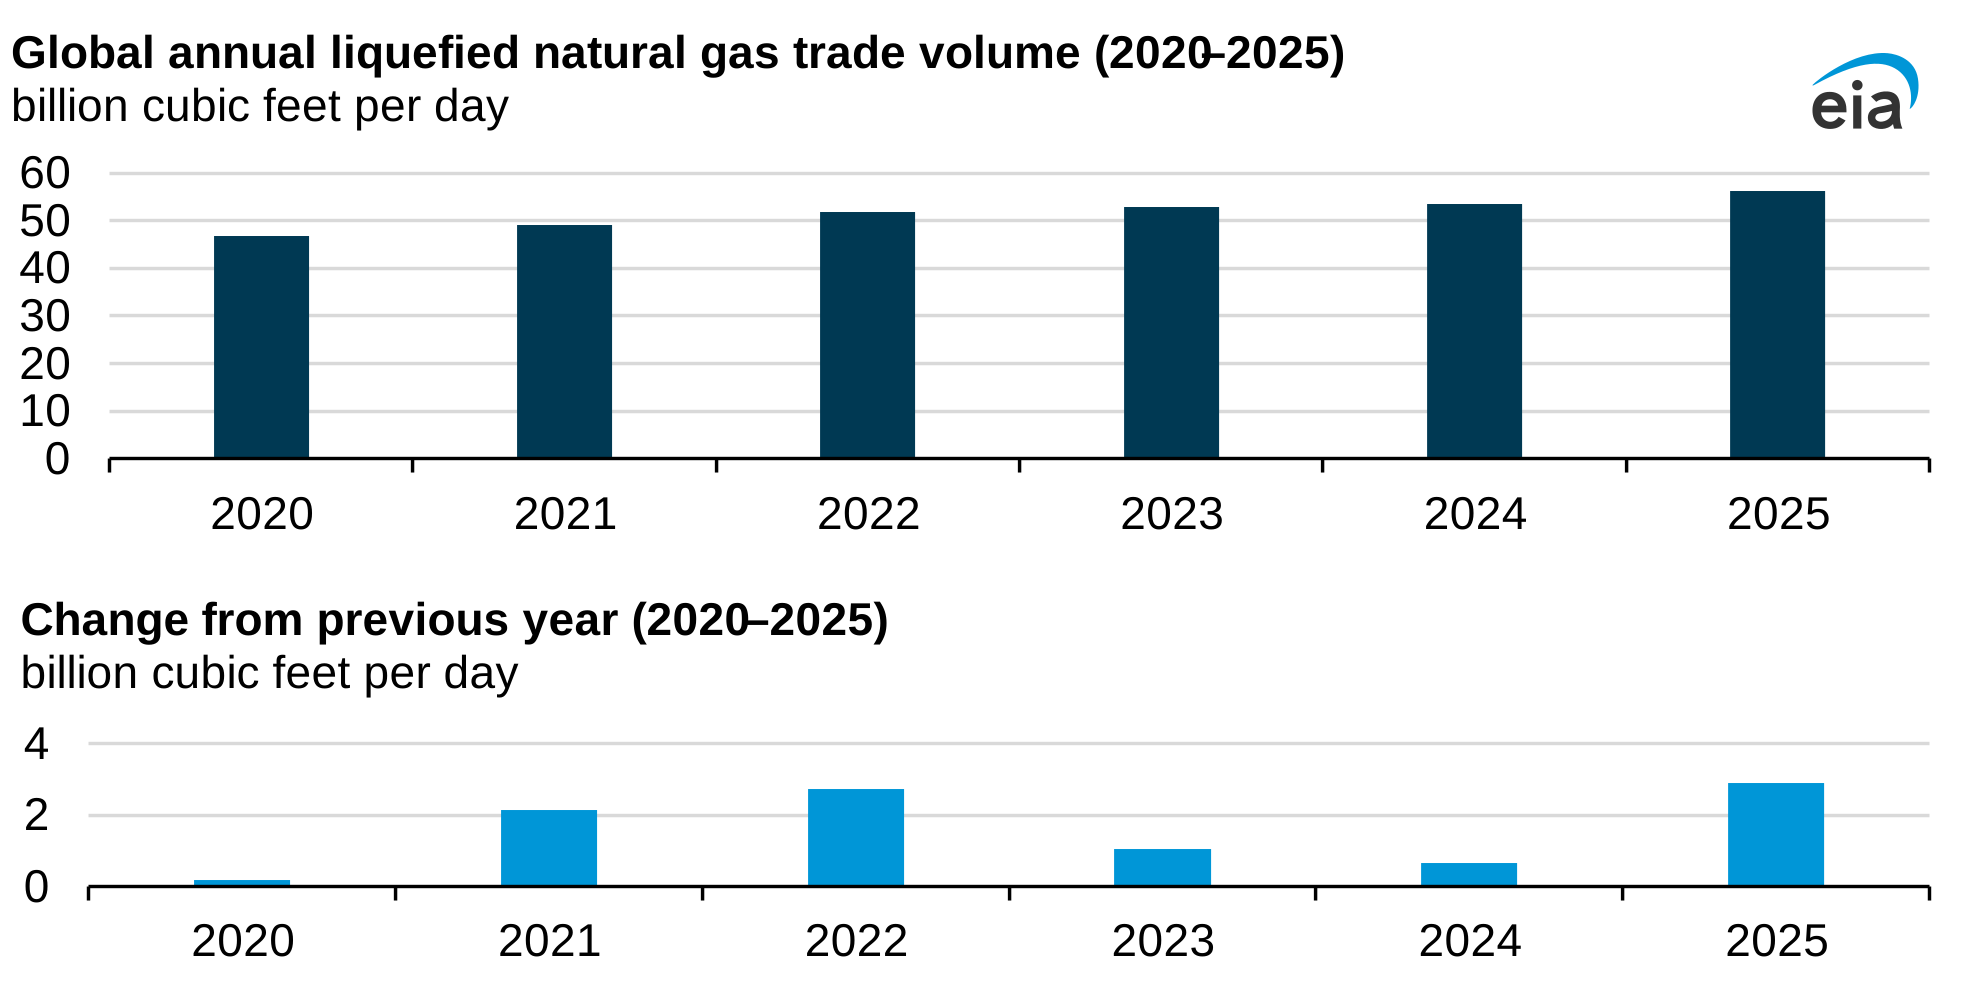
Data source: International Group of Liquefied Natural Gas Importers (GIIGNL)
Global liquefied natural gas (LNG) trade volumes increased 5.4% to a record 56.3 billion cubic feet per day last year (Bcf/d), driven largely by U.S. LNG export capacity expanding to meet growing demand, according to a recent report from the International Group of Liquefied Natural Gas Importers (GIIGNL). Global LNG trade has slowed this year following the closure of the key export route for Qatar, the world’s second-largest LNG exporter.
In-brief analysis
Jul 9, 2026

The United States remained the world’s largest crude oil producer in 2025, according to our International Energy Statistics database, extending a streak that began in 2018 when the United States overtook Russia to become the world’s leading producer.
In-brief analysis
Jul 8, 2026
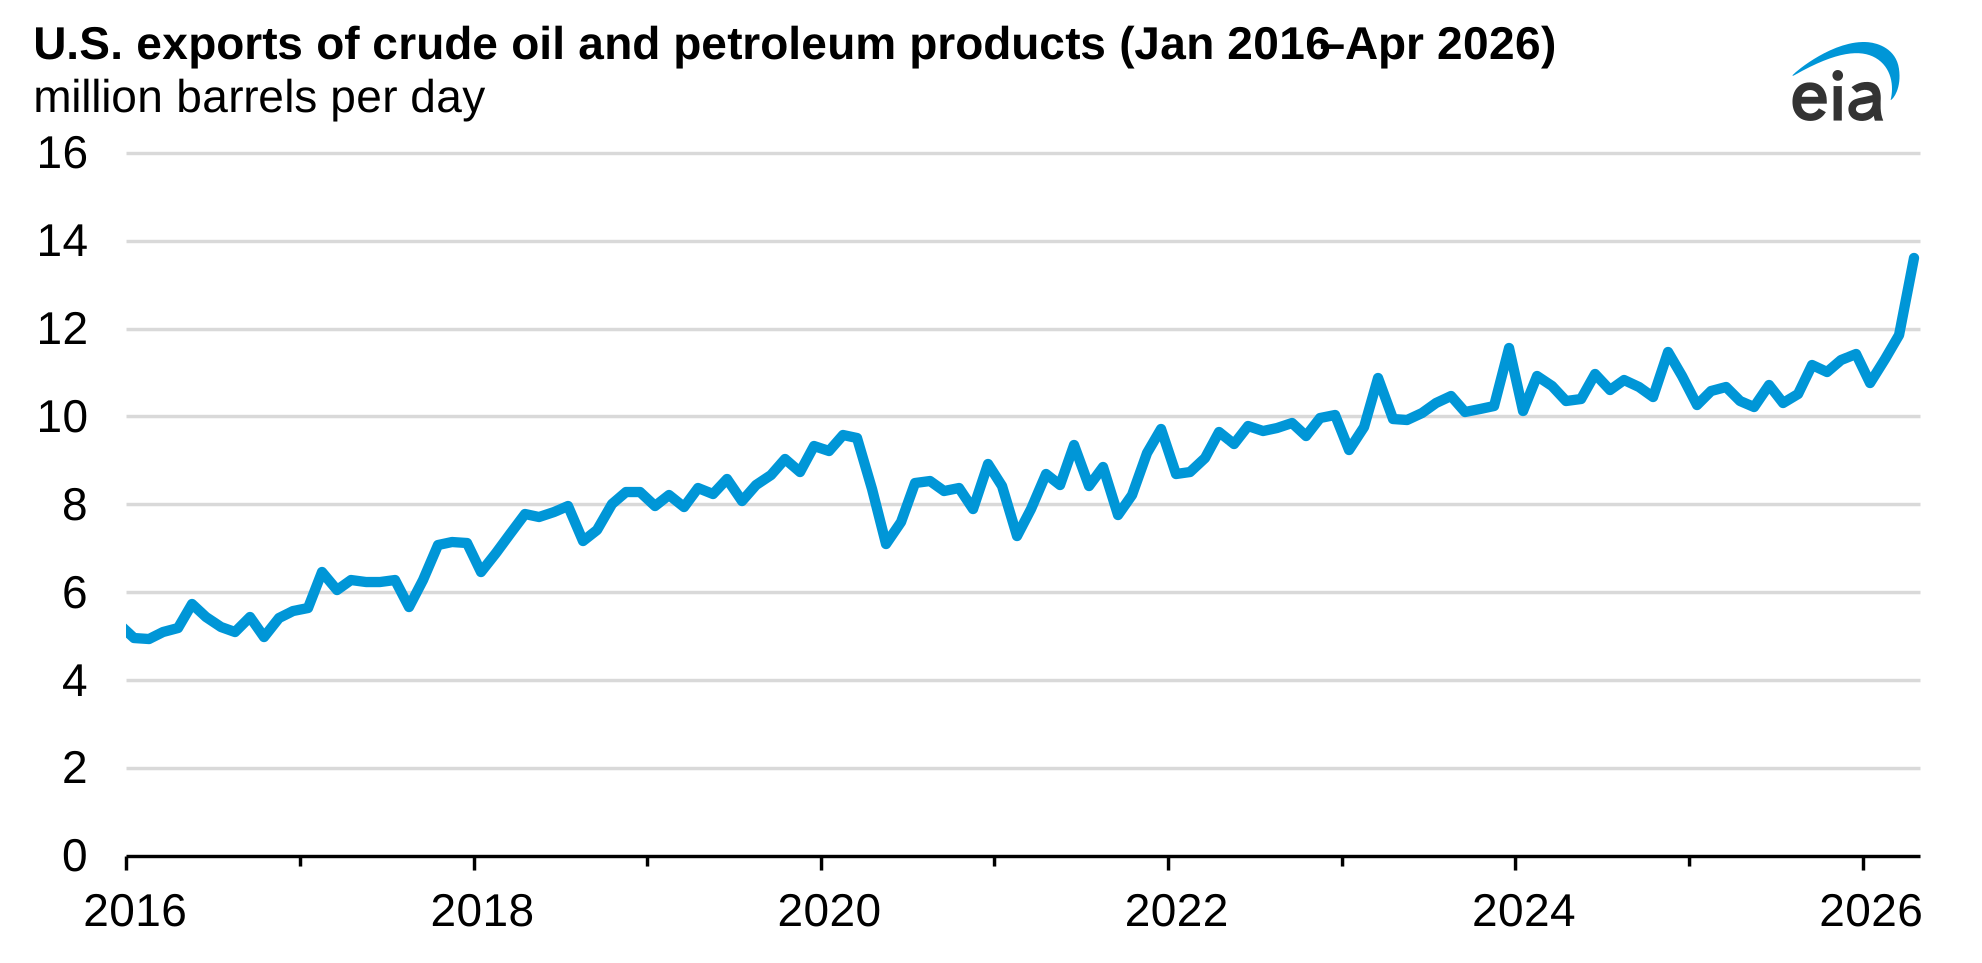
U.S. petroleum exports reached a record in April as disruptions to international crude oil and refined product flows through the Strait of Hormuz increased global demand for U.S. exports. Exports increased to 13.6 million barrels per day (b/d) in April, 15% more than the previous record set in March.
In-brief analysis
Jun 30, 2026
Over the 250-year history of our nation, energy consumption has evolved from wood use in the 18th and 19th centuries to today’s use of modern renewable, hydrocarbon, and nuclear technology. In 2025, total energy used in the United States was 96 quadrillion British thermal units (quads), up 2% from 2024, but below 2007’s record 99 quads. Petroleum was the most-used energy source last year, followed closely by natural gas. Use of renewable, coal, and nuclear energy each made up about 9% of total energy use.
In-brief analysis
Jun 29, 2026
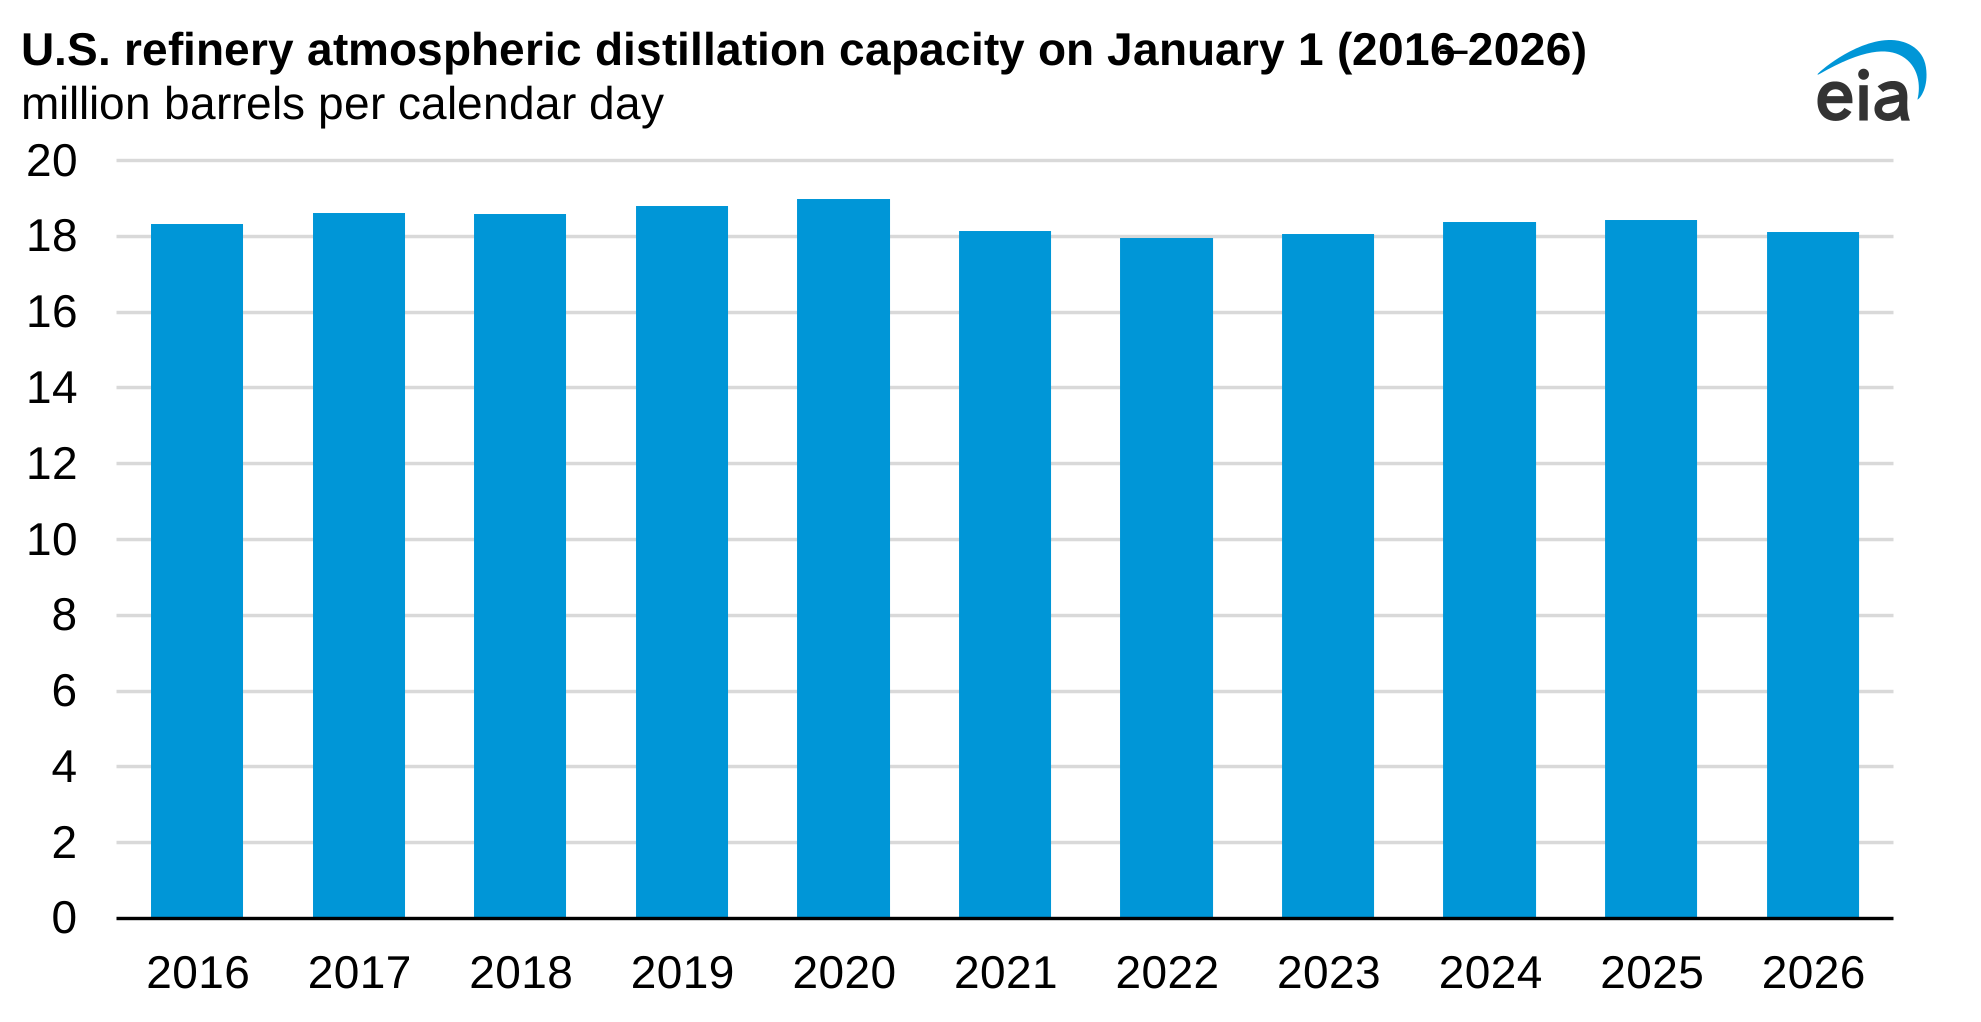
Data source: U.S. Energy Information Administration, Refinery Capacity Report
Note: Data reflect refinery capacity as of January 1 of the indicated year.
U.S. operable atmospheric distillation capacity, the primary measure of refinery capacity, totaled 18.2 million barrels per calendar day (b/cd) on January 1, 2026—down over 250,000 b/cd (about 1%) compared with January 1, 2025—according to our latest annual Refinery Capacity Report.
In-brief analysis
Jun 26, 2026
An increase in electricity generation from small-scale solar in New York has decreased the midday demand for metered electricity, amid overall declining load in the state. The trend is particularly notable in the early spring (March and April), when solar generation has an outsized impact because demand is relatively low and conditions for solar generation are favorable.
In-brief analysis
Jun 24, 2026
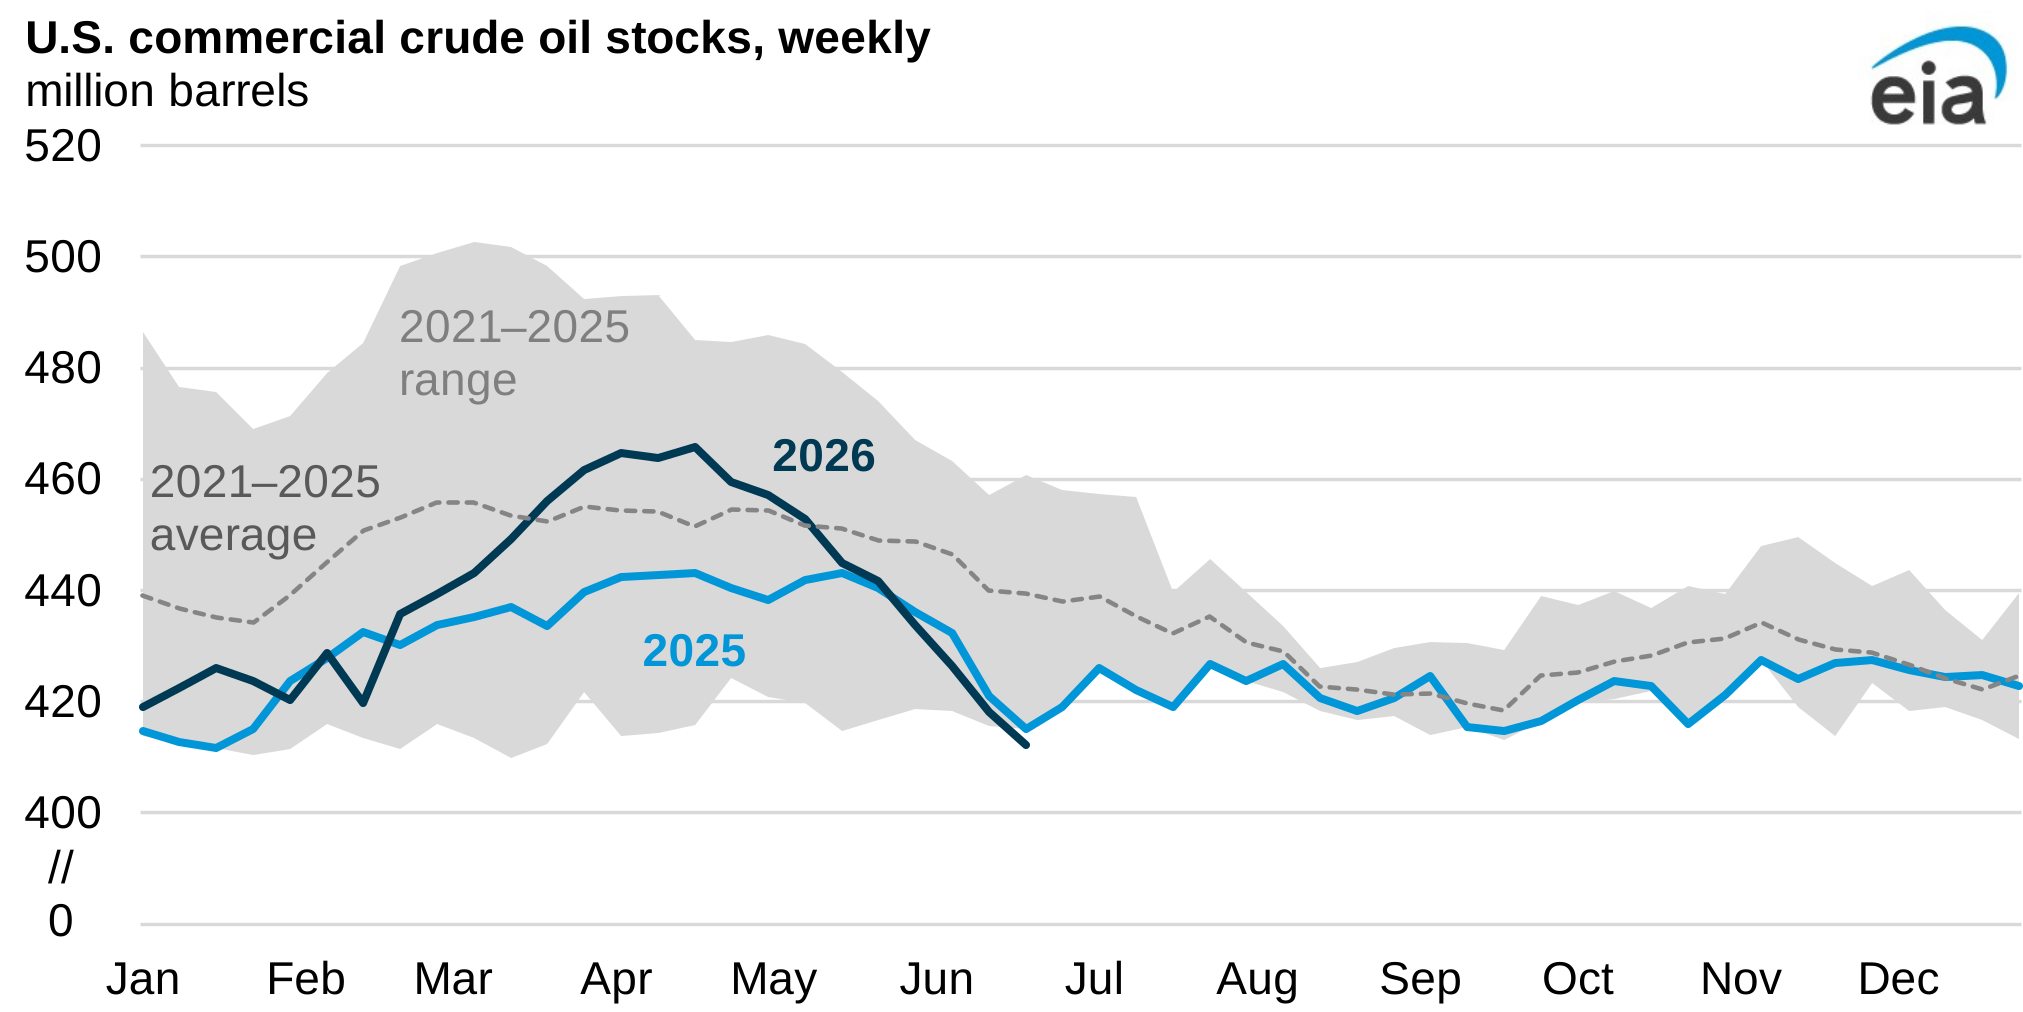
For the week ending June 19, 2026, U.S. refineries processed 17.1 million barrels per day (b/d) of crude oil, down 81,000 b/d from the previous week, and they operated at 96.1% capacity utilization. Gasoline production averaged 9.5 million b/d, and distillate production increased to 5.2 million b/d.
In-brief analysis
Jun 23, 2026
On April 28, 2026, the United Arab Emirates (UAE) announced that it was leaving OPEC, effective on May 1. OPEC was formed in 1960 by Iraq, Iran, Kuwait, Saudi Arabia, and Venezuela, with the stated objective to “coordinate and unify petroleum policies among Member Countries.” OPEC is best known for its effect on global crude oil prices.
In-brief analysis
Jun 18, 2026
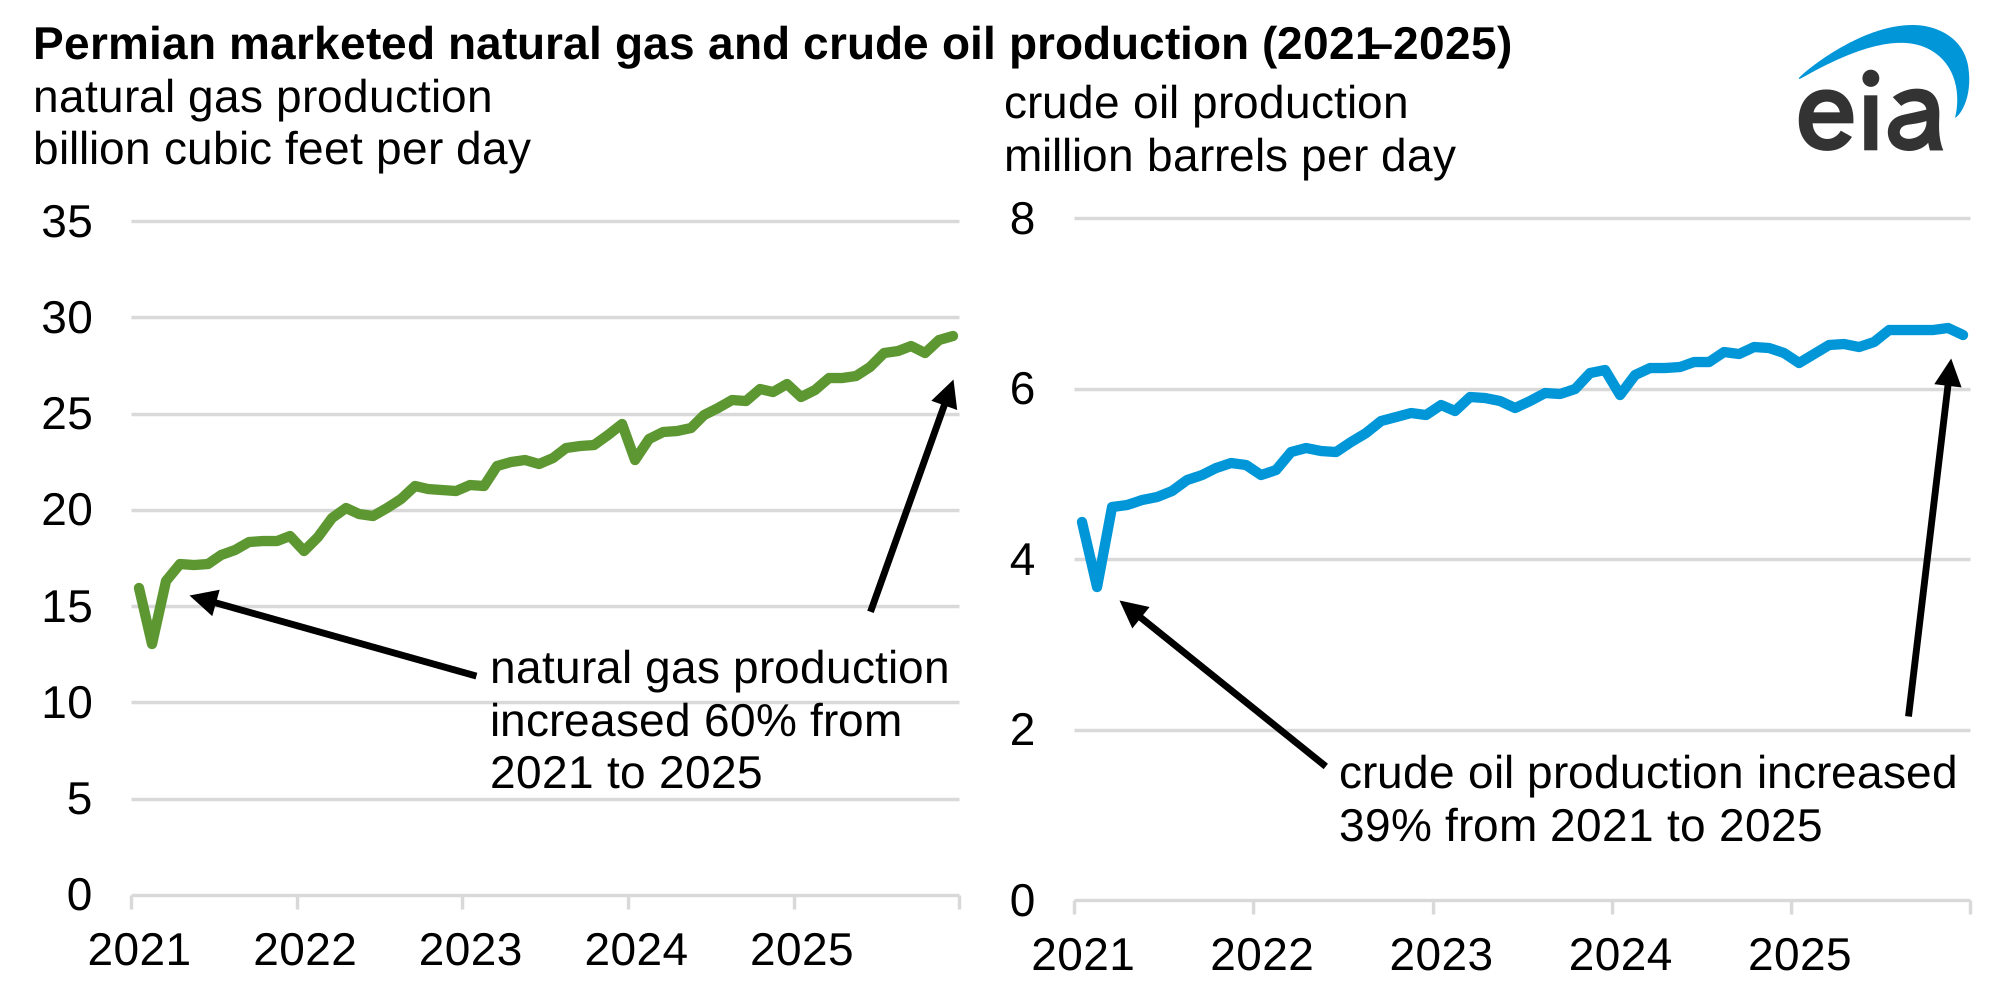
The Permian region’s marketed natural gas production grew from 17.2 billion cubic feet per day (Bcf/d) in 2021 to 27.6 Bcf/d in 2025, a 60% increase, according to data from our latest Short Term Energy Outlook. Over the same period, crude oil production grew by 39%, going from 4.7 million barrels per day (b/d) to 6.6 million b/d. The higher growth in natural gas production is the result of increasing gas-oil ratios (GOR).
In-brief analysis
Jun 16, 2026
In the first five months of 2026, utility-scale solar generation surpassed natural gas generation in CAISO. Solar electricity generation in the California Independent System Operator (CAISO) over the first five months of 2026 increased 21% compared with the same period in 2024, and natural gas generation decreased by 60%, data from our Hourly Electric Grid Monitor shows.
In-brief analysis
Jun 12, 2026
U.S. generating capacity for onshore wind farms
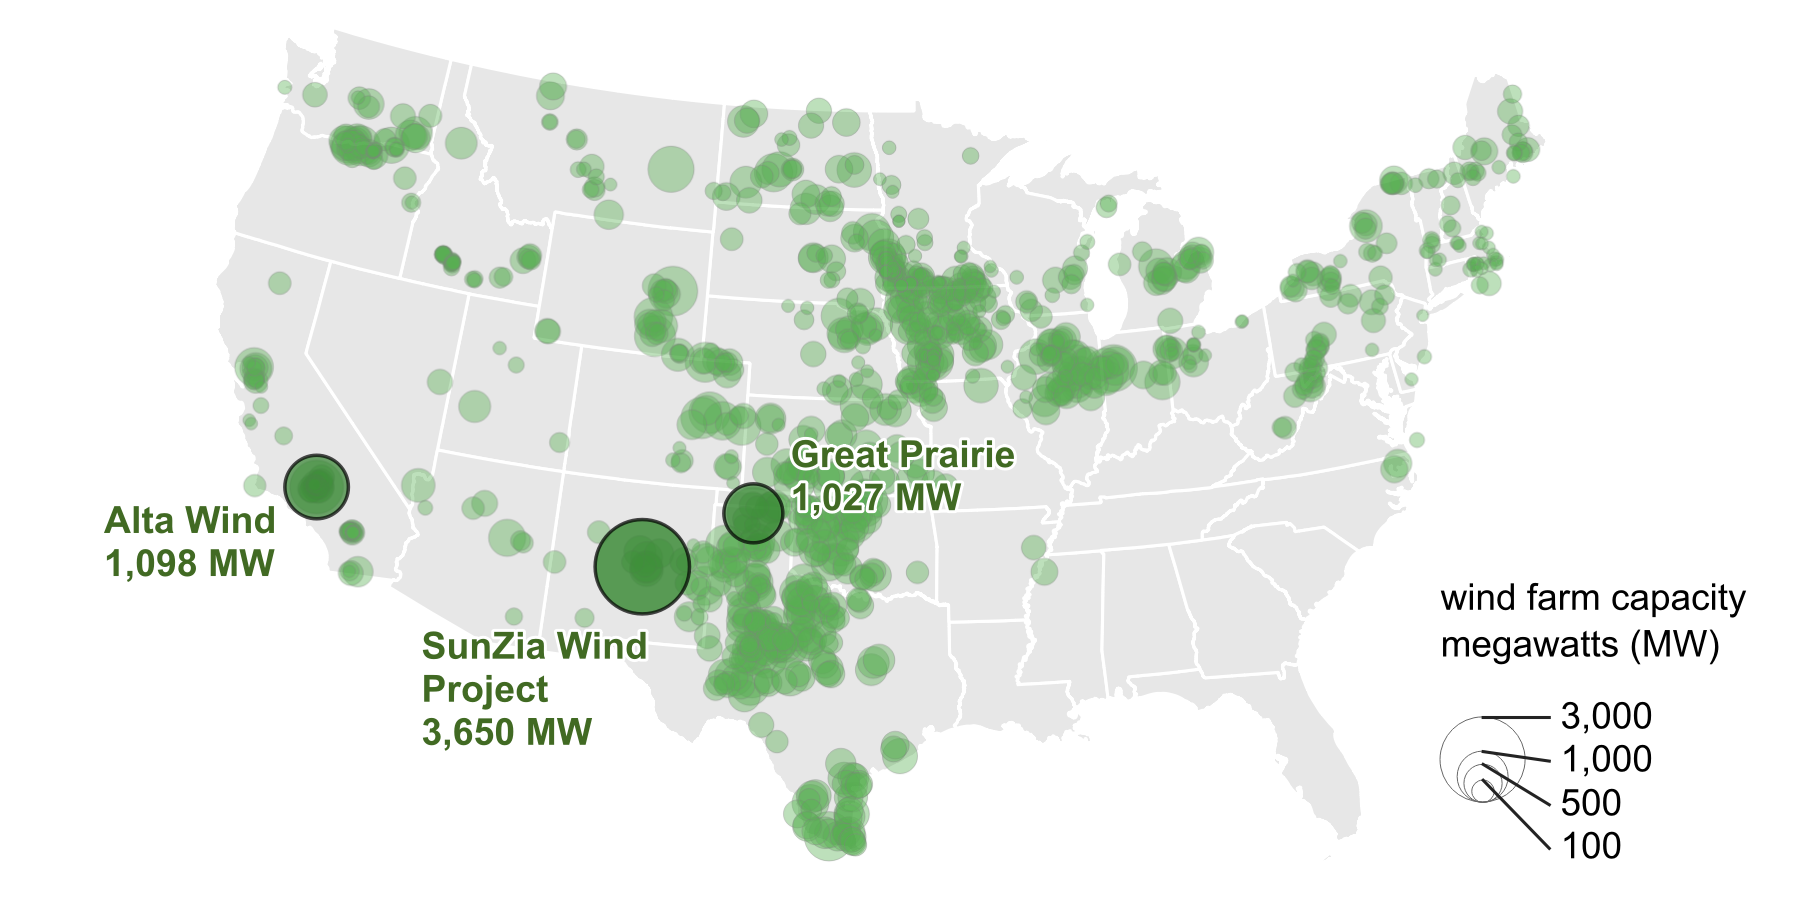
The SunZia Wind Project, the largest wind farm in the United States, is slated to begin commercial operations this month. The wind farm, located in New Mexico, has a total net summer generating capacity of 3,650 megawatts (MW) and is composed of 916 wind turbines. SunZia’s capacity is more than three times larger than the next two largest wind farms, Alta Wind in Southern California (1,098 MW) and Great Prairie in northern Texas (1,027 MW). The SunZia Wind Project works with a high voltage transmission line to deliver the wind power generated to Arizona and California.
In-brief analysis
Jun 10, 2026
Data source: Bloomberg L.P. and the U.S. Bureau of Labor Statistics
Note: RIN=renewable identification number; real prices are adjusted to May 2026 dollars.
Compliance credits for biomass-based diesel and ethanol have doubled in value since the start of this year. The credits, known as renewable identification numbers (RINs), have increased in price, mostly because of higher U.S. biofuel blending targets. The combination of high RIN prices and rising motor gasoline and diesel fuel prices has created an especially favorable market for producing and blending biofuels.
In-brief analysis
Jun 8, 2026
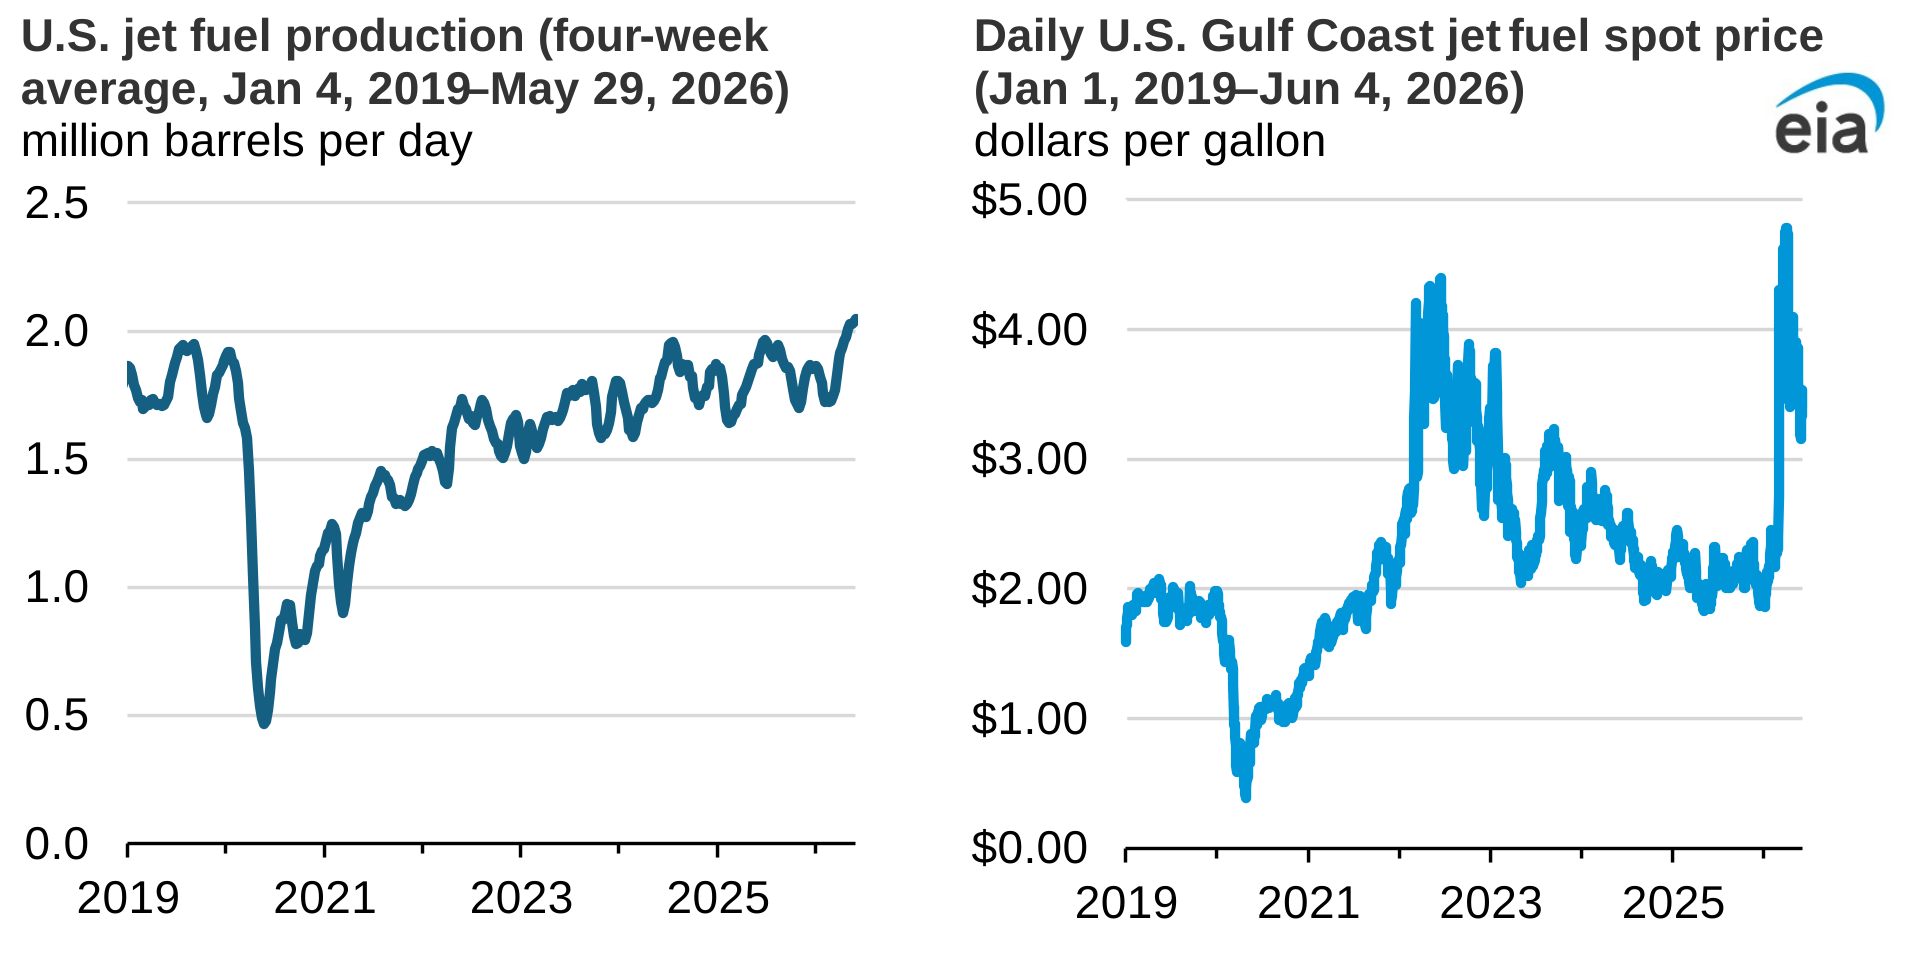
Weekly estimates suggest U.S. jet fuel production has increased to record highs in response to elevated jet fuel prices after the Strait of Hormuz closed on February 28. Higher crude oil prices and supply concerns, particularly in Europe and Asia, which previously imported much of their jet fuel supply from the Persian Gulf, have driven up jet fuel prices. Much of the increased U.S. jet fuel production is being exported, as domestic inventories remain above average.
In-brief analysis
Jun 5, 2026
Data source: U.S. Energy Information Administration, International Energy Statistics and estimates, and the International Atomic Energy Agency (IAEA)
Note: IAEA data are used to identify capacity additions in 2025 and 2026, which we then add to our International Energy Statistics estimate for 2024 to get the total capacities for 2025 and 2026. All values are in reference unit power.
From 2016 to 2024, China’s nuclear generation capacity increased 76% (24 GW), based on our International Energy Statistics (IES) data. According to the International Atomic Energy Agency’s Power Reactor Information System (PRIS), China added an additional 1.1 GW of nuclear power capacity in 2025 and 2.2 GW in 2026 (through May). China is continuing to build out its nuclear generating capacity and has 36 reactors under construction, accounting for more than 49% of total world nuclear construction, according to PRIS.