

Urban–rural structuring of mosquito assemblages in Moyen-Ogooué, Gabon reveals widespread dominance of Aedes albopictus
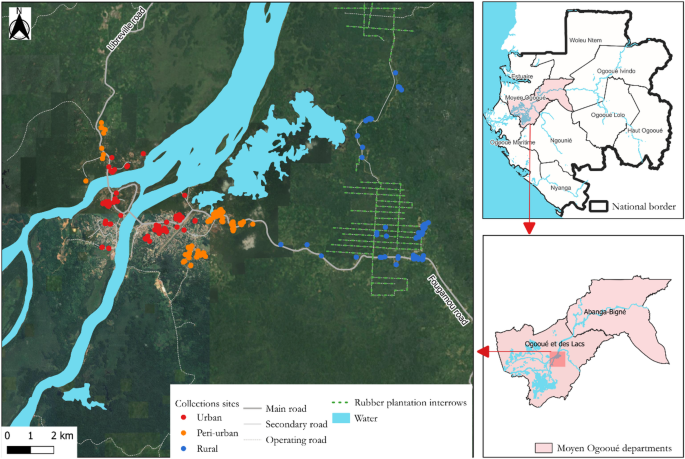
Capture patterns differed markedly among the three sampling methods (light traps, electrical aspirators, and ovitraps), with clear taxon-specific profiles (Table S2 and Fig. 2). Of the 22,216 mosquitoes collected in this study, 18,019 were captured as adults using two types of traps, light traps (n = 6,914) and electrical aspirators (n = 11,105), while the remaining 4,197 were larvae and pupae that developed into adults.
Several Aedes species were recorded predominantly or exclusively in their immature stages, including Ae. aegypti (99.6% of detections from larvae), Ae. apicoargenteus (99.5%), Ae. Argenteopunctatus (100%), and Ae. opok (100%). Erethmapodites sp. and Lutzia (including Lutzia tigripes) were detected exclusively in larval collections and were not recorded among adult captures.
Ae. albopictus showed a contrasting pattern, with most individuals captured as adults using electrical aspirators (83.8%), followed by larval sampling (15.9%), and only rarely detected in light traps. Light traps were the primary method for collecting Anopheles and Mansonia species: Anopheles coustani, Anopheles moucheti, Anopheles paludis, and Ma. uniformis were detected almost exclusively with light traps (> 98%), and similar patterns were observed for Coquillettidia sp. and Uranotaenia sp.
Among Culex species, collection profiles varied. Cx. quinquefasciatus was captured mainly by light traps (66.5%), followed by larval collections (21.2%), whereas Cx. antennatus showed a more even distribution between aspiration (65.5%) and light-trap sampling (34.5%). Cx. decens, Cx. poicilipes, and Cx. univittatus were collected by all three methods, with Cx. univittatus showing near-equal representation in light traps (44.4%) and larval samples (43.6%).
Heat map illustrating variation in mosquito abundance across species and sampling methods. Each cell represents the number of individuals collected for a given species–method combination, with a colour gradient from white (low abundance) to deep red (high abundance).
Geographic distribution of mosquito vectors
Across the urban–peri-urban–rural gradient, mosquito communities were structured by a small number of highly abundant species against a background of numerous less common taxa (Fig. 3). Ae. albopictus and Cx. quinquefasciatus were the most prominent contributors to overall abundance. Ae. albopictus dominated rural (63.7%) and urban (46.8%) communities but was less frequent in peri-urban areas (6.2%). In contrast, Cx. quinquefasciatus was strongly associated with more anthropogenic environments, representing 32.6% of urban and 27.7% of peri-urban collections but only 2.0% of rural specimens. Ma. uniformis was another major contributor, especially in peri-urban areas, where it comprised 40.3% of all mosquitoes, and remained important in rural (13.1%) and, to a lesser extent, urban (9.3%) habitats. Several species showed broad ecological distribution with moderate abundances: Ae. aegypti occurred at low but similar proportions across all three landscapes (1.4–2.7%). Cx. decens was recorded mainly in urban and rural areas.
Cx. univittatus was detected in all habitats but was more frequent in peri-urban (10.1%) and rural (6.0%) sites. Rural areas harboured the highest number of species with 24 taxa, whereas urban and peri-urban landscapes each hosted 19 species, underscoring greater taxonomic richness in the more natural parts of the landscape.

Spatial distribution of the four most predominant mosquito species according to the study areas (Urban to rural areas).
In addition to these dominant and broadly distributed taxa, a suite of species occurred at low frequencies in this study. These included several Aedes species detected almost exclusively in rural environments, Ae. argenteopunctatus, Ae. circumluteolis, and Ae. opok, as well as Anopheles paludis, Coquillettidia spp., Cx. giganteus, Cx. poicilipes, Cx. tritaeniorhynchus, Erethmapodites sp., and the predatory taxa Lutzia sp. and Lutzia tigripes, all of which together represented only a small fraction of the total collection. Ma. africana and Uranotaenia spp. were likewise infrequent, though the latter occurred at low but comparable proportions across all three landscapes. Overall, the data indicate that urban communities were dominated by a few well-adapted vector species, peri-urban areas are characterized by co-dominance of Culex and Mansonia, and rural sites combine extremely high Ae. albopictus abundance with the richest assemblage of less common and habitat-specialist species (Fig. 4 and Table S1).

Rank–abundance (Whittaker) curves by habitats. Species are ordered along the x-axis from the most to the least abundant within each locality. The y-axis shows relative abundance expressed as percentages. The slope of each curve reflects community evenness: steeper curves indicate strong dominance by a few species, whereas flatter curves indicate a more even distribution of abundances among species. Differences in curve length represent variation in species richness among localities.
Seasonal variation in mosquito relative abundance and species diversity
Across seasons, mosquito communities were shaped by a small number of dominant species whose dynamics shifted markedly with rainfall. Overall mosquito abundance increased significantly during the rainy season (p = 0.0021), a trend also evident in both urban (p = 0.0085) and rural (p = 0.0034) sites. During the rainy period, Ae. albopictus was overwhelmingly dominant, accounting for 62.4% of all individuals, far exceeding the contributions of Ma. uniformis (11.3%) and Cx. quinquefasciatus (9.8%), the next most abundant taxa. In contrast, the dry season showed a markedly different structure: Ma. uniformis emerged as the dominant species (38.1% of all dry season captures), followed by Cx. univittatus (18.4%) and Cx. quinquefasciatus (17.9%) (Fig. 5 and Table S1). Ae. albopictus declined to 8.2% of dry-season collections, while Ae. aegypti increased proportionally from 1.1% (rainy) to 7.9% (dry), despite remaining a minor overall contributor. Several species, such as Anopheles gambiae s.l., Anopheles moucheti, Cx. bitaeniorhynchus, Coquillettidia sp., and Uranotaenia sp., were present in both seasons with moderate and relatively stable frequencies, each contributing between roughly 0.3–1.5% per season. Overall, rainy-season communities were defined by the explosive dominance of rainfall-responsive species, especially Ae. albopictus, whereas dry-season assemblages were more evenly structured, with Ma. uniformis, Cx. univittatus, and Cx. quinquefasciatus forming the core of the community.
Many species were detected only at very low frequencies, allowing only cautious statements about their seasonal occurrence. Several taxa appeared exclusively or predominantly during the rainy season, including Ae. argenteopunctatus, Ae. circumluteolis, Cx. antennatus, and Cx. tritaeniorhynchus, all of which were recorded only in small numbers. Conversely, a few rare taxa were found only during the dry season, such as Anopheles paludis, Erethmapodites sp., Lutzia sp., and Lutzia tigripes. Other infrequent species, Ae. opok, Cx. giganteus, and Cx. poicilipes, were observed in both seasons but remained numerically scarce throughout. All of these taxa were represented by small numbers of individuals and occurred sporadically across seasons and habitats.

Rank–abundance (Whittaker) curves by seasons. Species are ranked along the x-axis from the most to the least abundant within each season. The y-axis displays relative abundance expressed as percentages. The slope of each curve reflects community evenness: steeper slopes indicate dominance by a few species, whereas flatter slopes indicate a more even distribution of species abundances. Differences in the length of the curves represent variation in species richness between the rainy and dry seasons.
Seasonal variation across landscapes types
Patterns of richness and diversity varied strongly across landscapes and seasons). Species richness was consistently highest in rural sites (21 species in the rainy season and 19 in the dry season). In the rainy season, richness was slightly higher in urban areas (19 species) than in peri-urban areas (18 species), whereas in the dry season, peri-urban areas (15 species) had higher richness than urban environments (14 species), where the lowest values were recorded. Total mosquito abundance was highest in rural areas during the rainy season (12,992 individuals), compared with 3,343 in urban and 1,828 in peri-urban sites.
The Shannon diversity index (H′) revealed additional differences in community structure. Urban areas showed slightly higher Shannon index values in the dry season.
(H′ = 1.44) than in the rainy season (H′ = 1.34), indicating reduced dominance outside the peak rainfall period. Peri-urban sites exhibited the highest Shannon index overall, particularly during the rainy season (H′ = 1.87), reflecting the contribution of several co-occurring taxa to overall community structure, while still maintaining a moderate diversity in the dry season (H′ = 1.39). In contrast, rural sites showed the lowest Shannon index during the rainy season (H′ = 1.19) despite having the highest species richness, indicating strong dominance by a single species. During the dry season, the Shannon index in rural areas increased substantially (H′ = 1.73), reflecting a more even distribution of individuals across taxa.
The non-metric multidimensional scaling (NMDS) ordination further supported these seasonal and spatial differences (Fig. 6). In rural areas, the distance between rainy- and dry-season samples was large, indicating strong seasonal turnover in species composition. Peri-urban sites displayed only minor seasonal shifts, while urban sites showed intermediate differences between seasons. Overall, samples from the three landscapes formed distinct clusters in ordination space, with peri-urban assemblages positioned between the urban and rural groups. The near-zero stress value (stress = 0) indicates a clear representation of community dissimilarities in the two-dimensional ordination.

Non-metric multidimensional scaling (NMDS) ordination based on Bray–Curtis dissimilarities of mosquito assemblages across localities (Urban, Peri-urban, Rural) and seasons (Rainy, Dry). Spider lines connect seasonal samples within each locality to their centroids (cross symbols). NMDS1 and NMDS2 represent the two ordination axes that summarize multivariate differences in community composition; the relative distances between points reflect dissimilarities in species assemblages (closer points indicate more similar communities). The ordination stress was zero, indicating a perfect two-dimensional representation of sample dissimilarities.
Credit: Source link
Comments are closed.